Products
Solutions
Resources
9977 N 90th Street, Suite 250 Scottsdale, AZ 85258 | 1-800-637-7496
© 2024 InEight, Inc. All Rights Reserved | Privacy Statement | Terms of Service | Cookie Policy | Do not sell/share my information

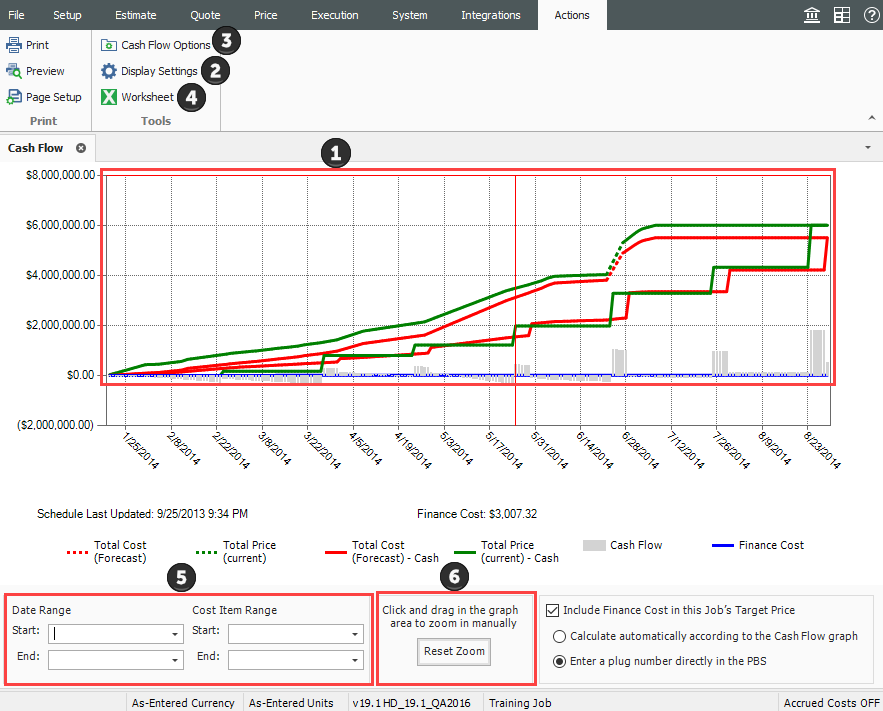
The Cash Flow form provides a graphical representation of the cash flow and resource utilization of your project, so you can quickly assess financing and resource needs.
You can open the Cash Flow form by selecting the Estimate tab from the Estimate landing page, then selecting Cash Flow from the Schedule section.
To generate a cash flow curve, the estimate must be populated with schedule dates either manually or directly from InEight Schedule or other compatible application that integrates with Estimate. For more information bout InEight Schedule, see InEight Schedule Integration.
The table and image below show an overview of the Cash flow form.
|
Section |
Description |
|---|---|
|
1
|
The graph displays the projected cash flow of your project, along with job financing expense, individual cost category costs and resource utilization.
|
|
2 |
Click on the Display Settings icon to indicate what to display on the graph.
|
|
3 |
Click on the Cash Flow Options icon to specify revenue timing, cost timing, and cost of money. |
|
4 |
Click the Excel icon to export the numerical data represented on the graph into an Excel spreadsheet where you can run additional analysis. |
|
5 |
You can filter the Cash Flow graph by date range or by a range of cost items. |
|
6 |
Click and drag over the graph to zoom in on a particular section. Click the Reset Zoom button to restore the graph to its original state. |
Using the Period Quantities cost curve type as an example, on the Cash Flow graph, you can see that 50% of the total cost for this cost item, represented by the red line, is incurred in the first period of the project. Half of the project’s cost is incurred during the first period of the project’s lifespan as determined by what is entered in the cost item’s period quantities.
A reason half of the project’s cost is being used during the first period could be that resources available to perform the project happen to be mostly available during the front end of the project.
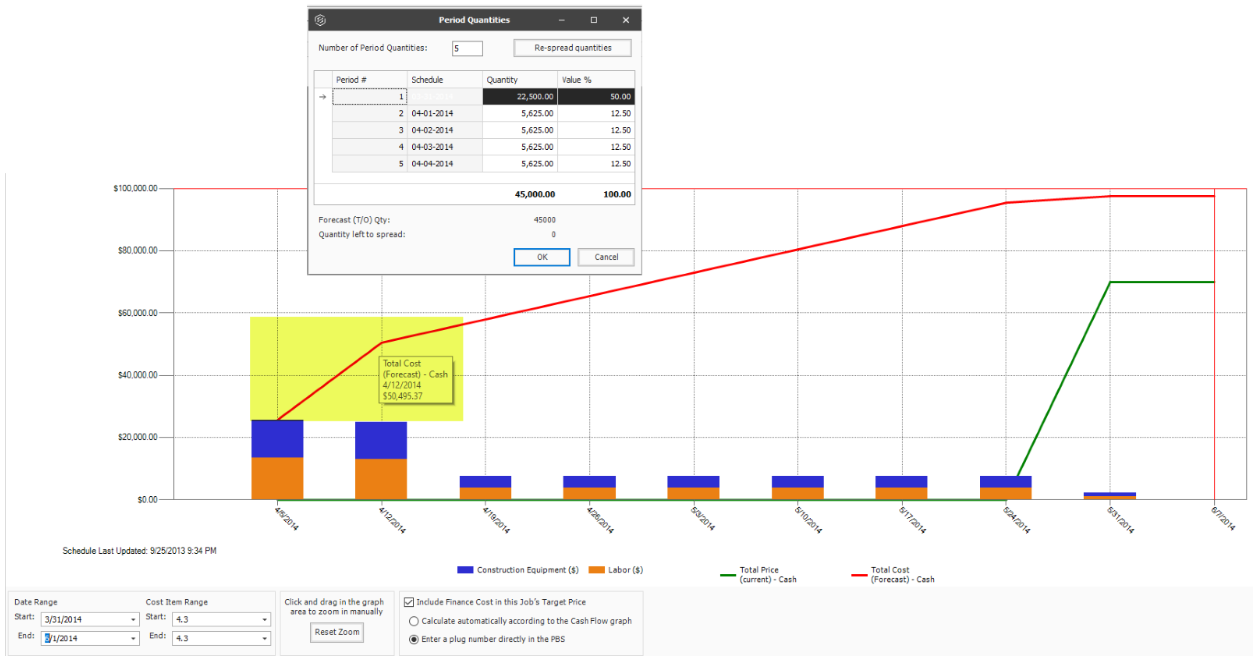
After the first period, the project incurs the remaining balance of the total project cost of $95,000. This is spread equally with quantities of $5,625 amongst the last three periods. This information helps you to better understand when the owner provides payment, in addition to deciding if more project funding or financing is needed.
Most costs on this one item will be incurred at the end of the activity, such as a subcontractor billing for most of his work as it nears completion. If its determined costs are incurred towards the end of the activity, you can attribute most of the cost items quantity in the last period. You can add any number of additional periods to a custom cost curve or to a cost curve defined by period quantities curve and the costs will be proportionally spread across the actual number of periods defined by the Cost Items start and finish dates and cash flow settings. Be aware, reducing the number of periods in a front or back end loaded curve may show a steeper total cost in some periods.
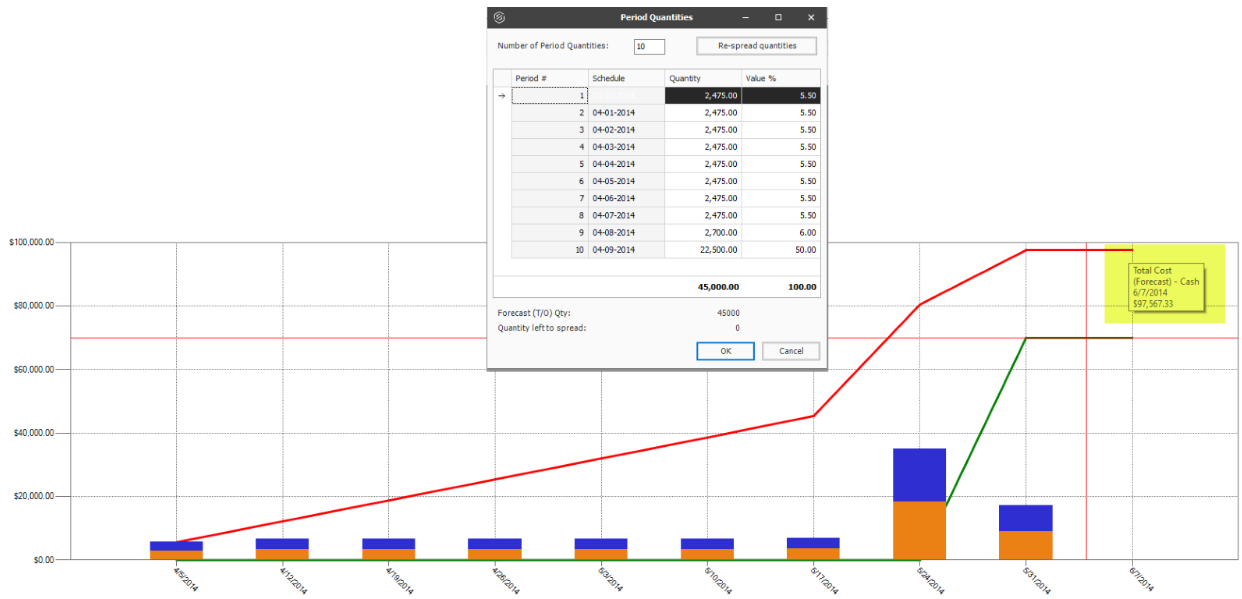
Using period quantities as the cost curve helps you determine how much of a cost item’s cost is going to be spread in different durations of time.
Additional Information
9977 N 90th Street, Suite 250 Scottsdale, AZ 85258 | 1-800-637-7496
© 2024 InEight, Inc. All Rights Reserved | Privacy Statement | Terms of Service | Cookie Policy | Do not sell/share my information